Climate Risk and Resilience Index
A resilience-adjusted approach to climate risk
Overview
AlphaGeo’s Climate Risk and Resilience Index (CRRI) measures climate risk for any location through a resilience-adjusted lens, modelling both physical climate risk as well as resilience-adjusted risk that factors in the adaptation capacity of the location, society, and asset. This allows users to model likely real-world impact, not just hazard exposure.
The result is a view of both unadapted risk and adapted risk, as well as a quantification of the location's adaptive capacity and resilience. The CRRI can be used to screen locations, compare assets, plan for adaptation, and support climate disclosure and reporting requirements.

Our approach: Resilience-adjusted risk
Traditional climate risk models focus on hazard intensity. They often miss how local adaptation changes outcomes on the ground.
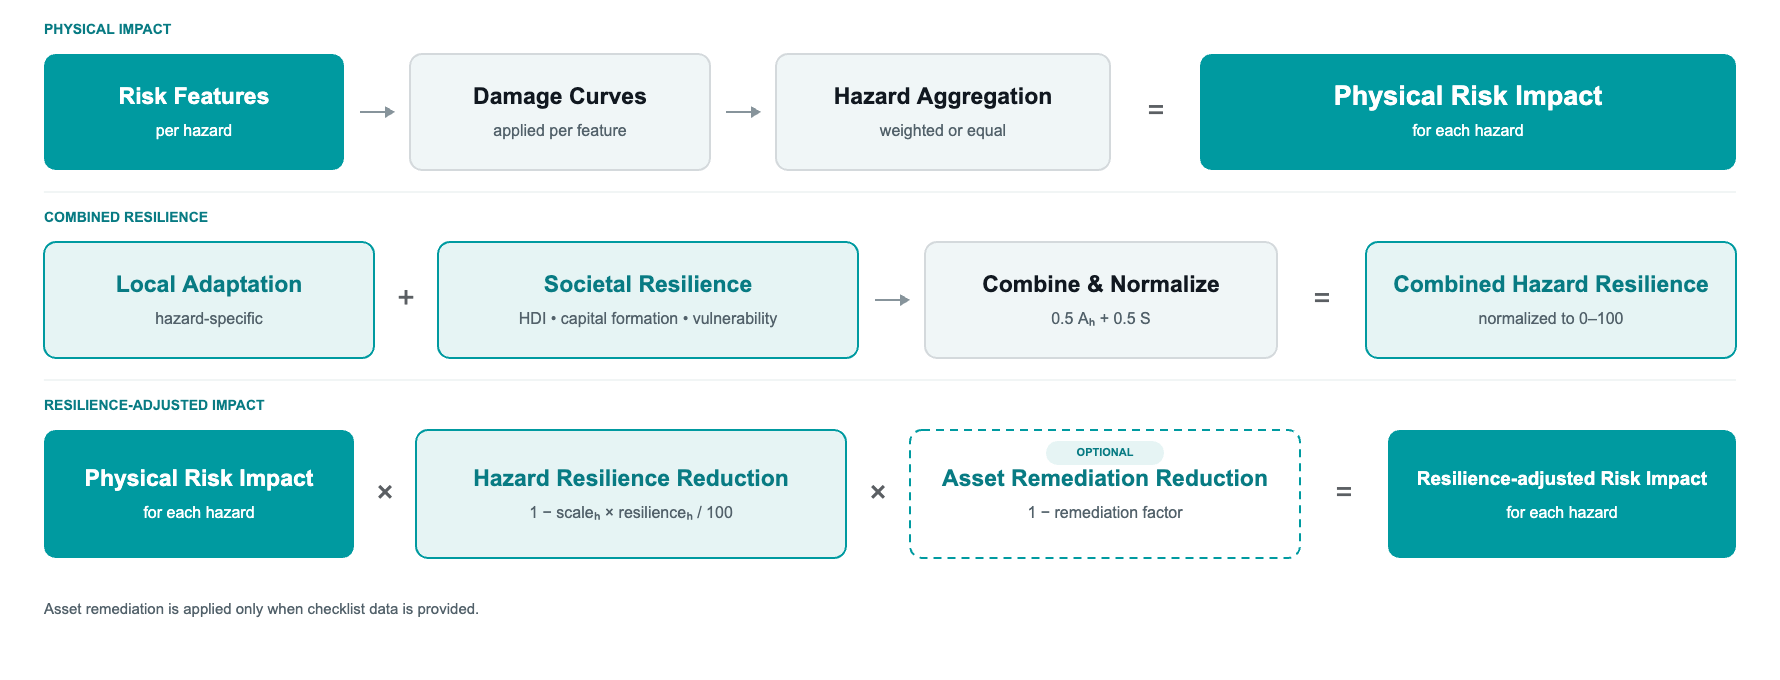
CRRI addresses that gap with AlphaGeo’s resilience-adjusted risk methodology. It first computes physical climate risk, converting each hazard measurement into expected damage through damage functions anchored to published damage research, then accounts for local adaptation capacity and societal resilience. Where checklist data is provided, asset-level remediation measures are also considered.
This approach produces two complementary views:
Physical Risk Scores — the hazard-only baseline derived from climate models (i.e., unmitigated, or undefended risk)
Resilience-Adjusted Risk Scores — the likely real-world impact after accounting for resilience and available asset-level remediation data (i.e., mitigated, or defended risk)
This helps users move beyond risk identification. It supports adaptation planning, capital allocation, and resilience strategies.
Triple-layer adaptation offset
CRRI's unique Resilience-adjusted Risk Framework uses three layers of adaptation and resilience data to move from hazard exposure to likely real-world impact.
Local adaptation capacity, such as flood defenses or drainage systems.
We quantify hazard-specific adaptation capacity using our proprietary Global Adaptation Layer, the world's first commercially available, multi-hazard database on global adaptation capacity.
Societal resilience, measured from human development, capacity to invest in physical infrastructure, and demographic vulnerability.
Where asset data is available, an optional asset-level remediation workflow.
Local adaptation capacity and societal resilience are combined for each hazard. Asset-level remediation is included only when checklist data is available.
This third layer is powered by the Remediation Checklist, which captures the mitigation measures in place at the building or asset level. That makes the Remediation Checklist a key feature of CRRI, extending the index from location-level risk screening to asset-level adaptation planning and helping users quantify how specific resilience measures can further reduce risk.


Hazard categories
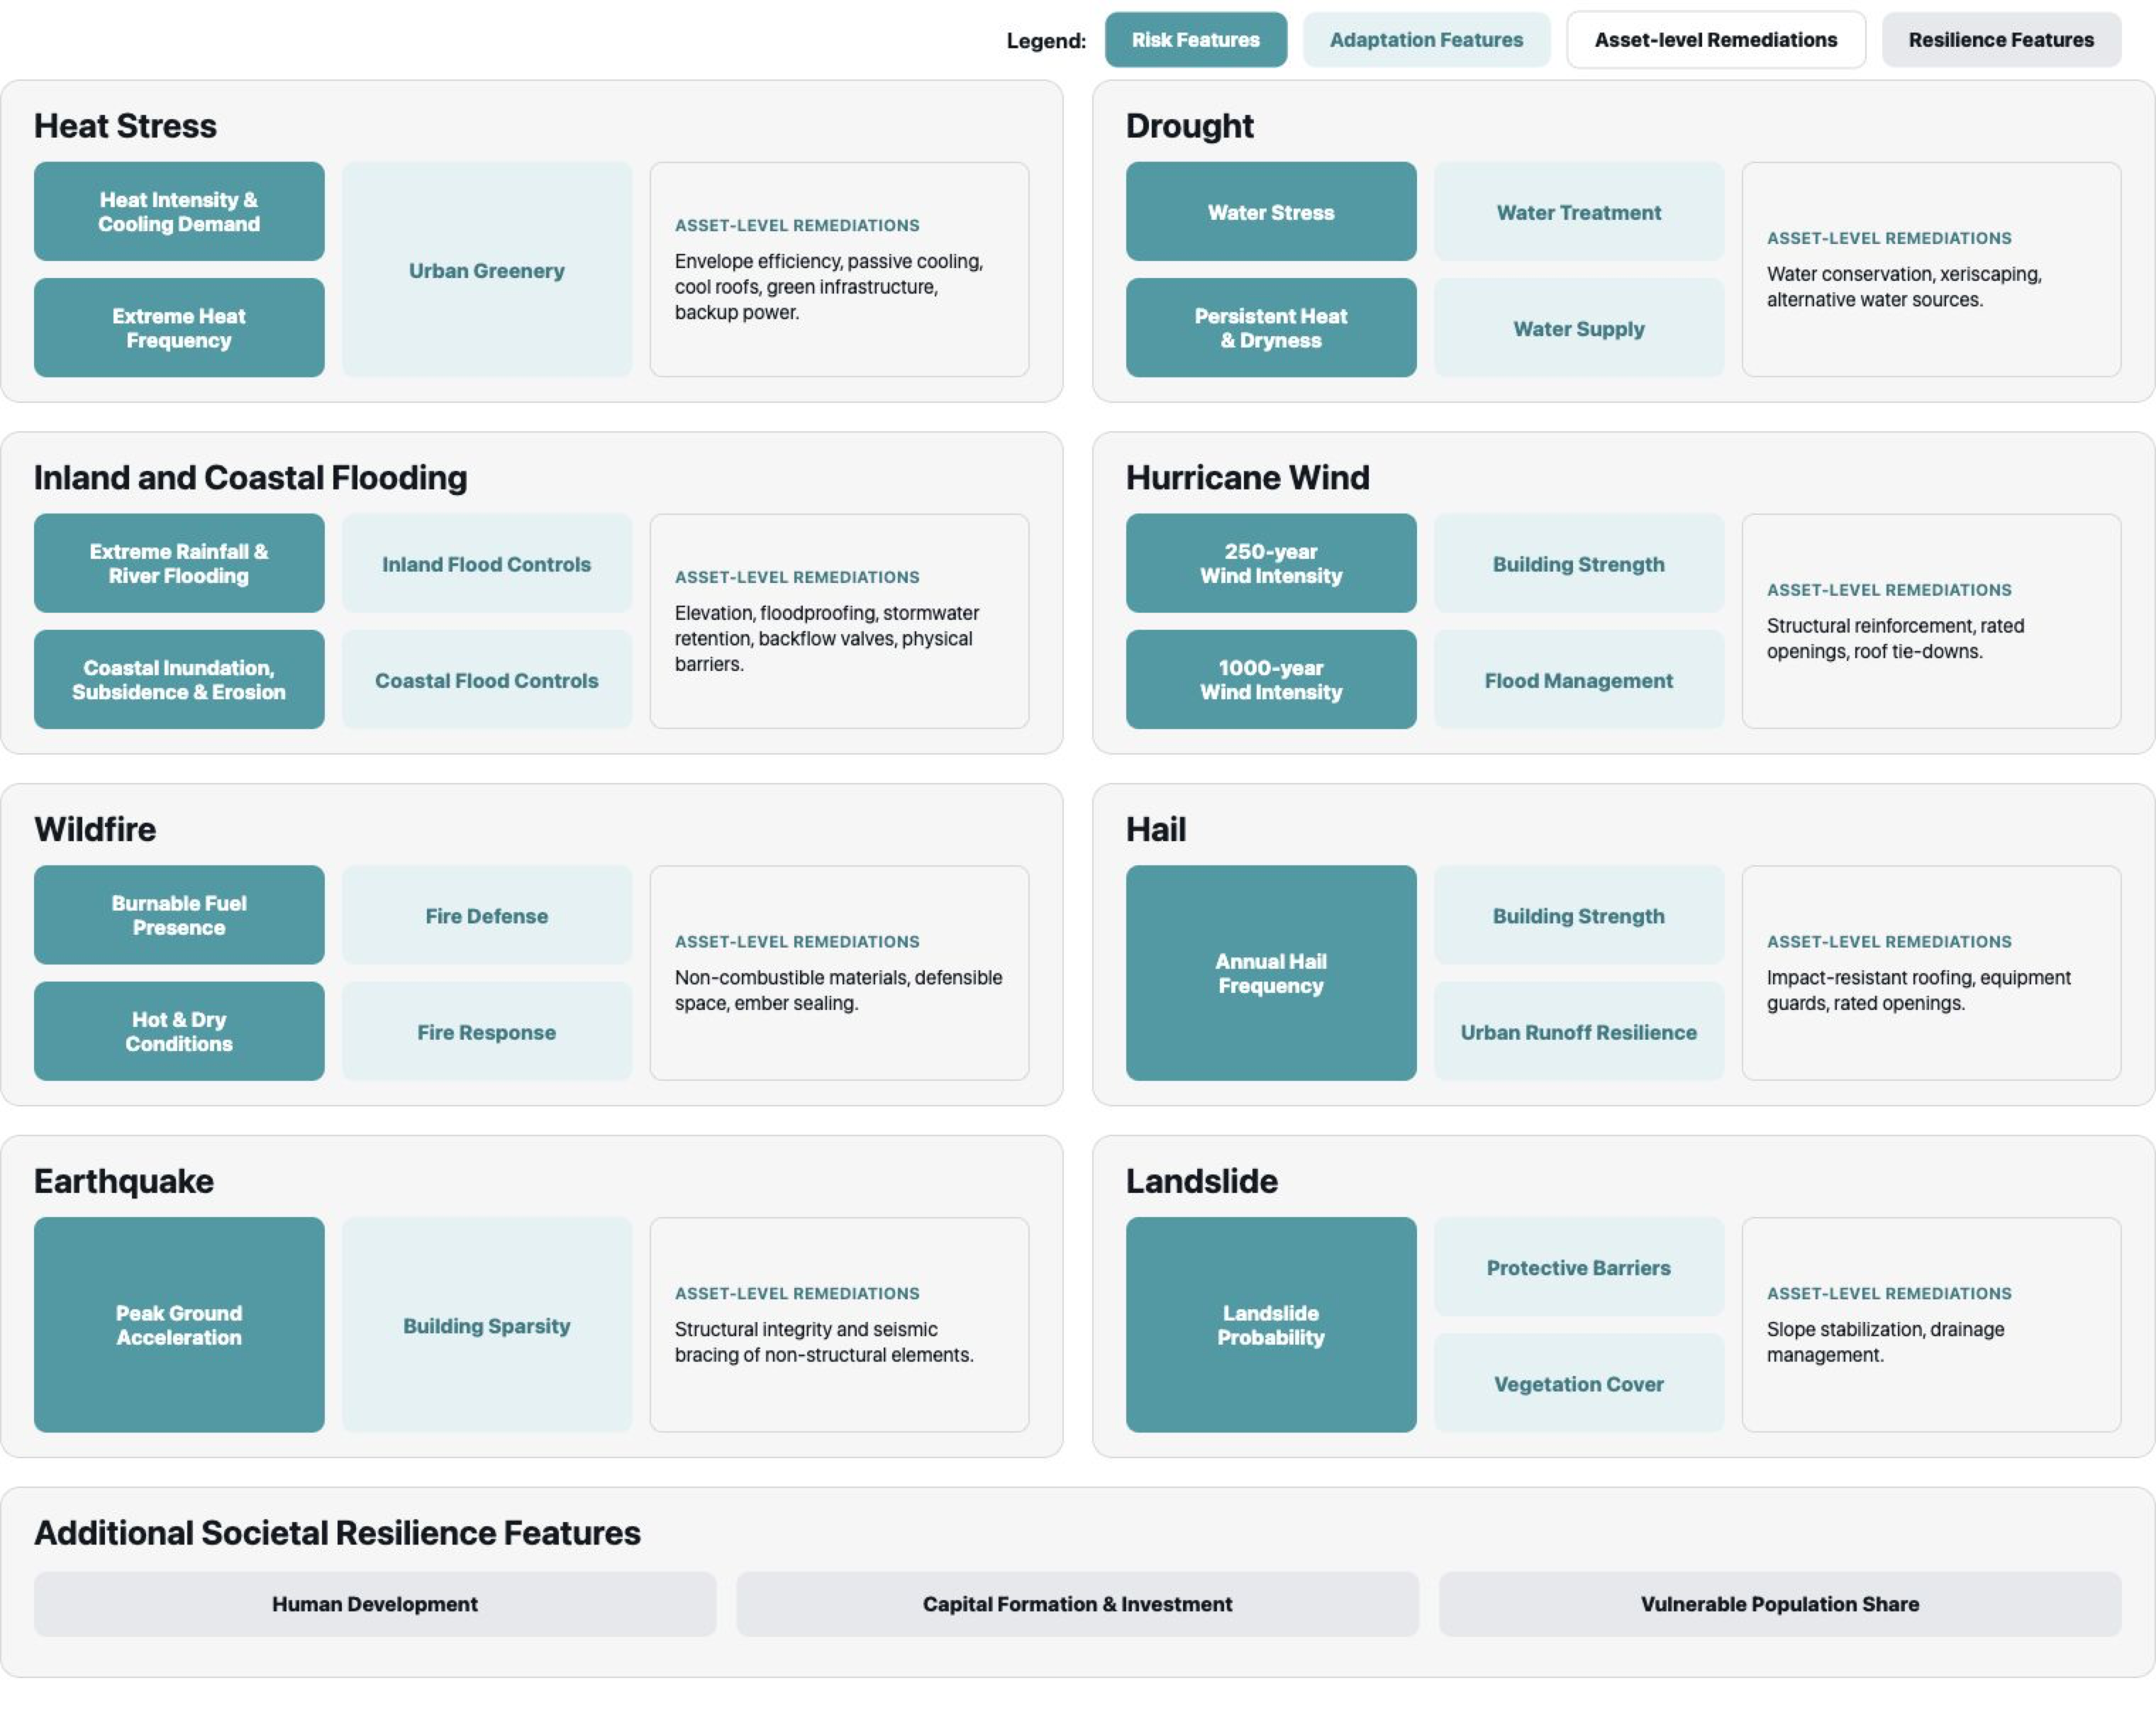
The CRRI includes data on risk, adaptation, and resilience for 9 acute and chronic hazard categories:

Heat Stress: Evaluates the risk of extreme heat on buildings, productivity, and thermal comfort. Adaptation capacity data includes building density and urban greenery, which shape local heat island effects and cooling potential.
Drought: Assesses the risk of prolonged water stress, supply disruption, and land degradation. Adaptation capacity data includes water works, water storage, water amenities, and groundwater well access.
Inland Flooding: Identifies risk from riverine flooding, flash flooding, and heavy rainfall runoff. Adaptation capacity data includes surface porosity, flood barriers, drainage systems, storage and control infrastructure, and nature-based flood solutions.
Coastal Flooding: Analyzes risk from sea-level rise, storm surge, coastal inundation, and erosion. Adaptation capacity data includes coastal defenses, natural buffers, drainage capacity, and coastal flood control infrastructure.
Wildfire: Assesses the likelihood and potential impact of wildfire on structures, infrastructure, and surrounding land. Adaptation capacity data includes fire response infrastructure, fire prevention measures, and fire detection systems.
Hurricane Wind: Assesses extreme wind intensity using CHAZ/CLIMADA modelled return-period wind speeds. Adaptation capacity data includes building strength, storage and control infrastructure, and flood barrier proximity.
Hail: Assesses the risk of damaging hailstorms that can impact roofs, facades, glazing, vehicles, and exposed equipment. Adaptation capacity data includes building strength and other local protection proxies that reduce surface damage exposure.
Landslide: Evaluates the risk of slope failure caused by unstable terrain, saturated soils, and ground movement. Adaptation capacity data includes vegetation cover and proximity to manmade barriers that help stabilize slopes.
Earthquake: Assesses seismic risk from ground shaking and related ground failure affecting structures and infrastructure. Adaptation capacity data includes building strength and building sparsity, which help indicate likely structural resilience and spillover vulnerability.
Use cases
Site selection and acquisition due diligence
Portfolio risk assessment and management
Adaptation planning and resilience investment
Climate risk disclosures and reporting, including GRESB, TCFD, IFRS S2, ISSB, EU Taxonomy, and others
Stakeholder engagement and communications
Data details
Resolution: Asset-level; down to 5-10 meters
Timescales: 2025, 2035, 2050, 2100
Emission Scenarios: SSP245, SSP370, SSP585
Detailed Methodology
Please fill out our Methodology Request Form, and a member of our team will get back to you, typically within one business day.
Last updated
Was this helpful?